Mussel Memory Weeks Five & Six

And so, we have reached the end, and we can finally take a step back and see all the work we have done. I hope you are all proud of yourselves - I know I am.
I decided not to post last week, because I was not doing anything I have not already explained. It was simply a week's worth of data collection, and stress about not finishing in time. I also had to redo a significant part of my results, which a little stressful. I found that I just needed to push through that week; if I had stopped to reflect in a post like this, I think I would have freaked out even more.
Alas, my worrying was for nothing, as I got it all done. My final week was going to finally be something other than the monotonous lab tasks I have been doing all summer. But a change in task came at a price; it would involve math and coding!
Learning to code
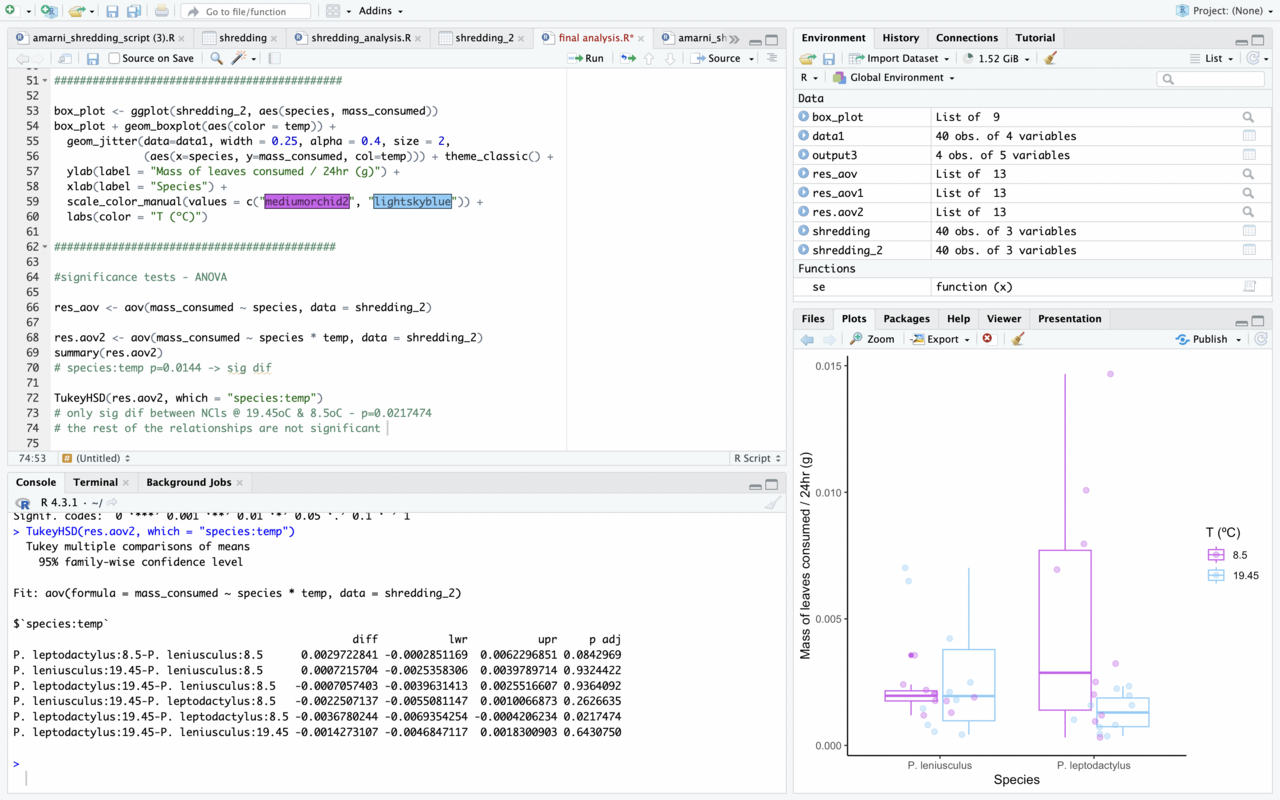
In ecology, the coding programme 'R' is used for data analysis and visualisation. I met with my supervisor, who was thrilled with my results, to get to terms with this coding business. Firstly, I was very grateful for her enthusiasm about my work, as it gave me the sense that my data was in fact valuable and useable. I watched her play around with the data, giving me the advice to play around with graphs first, as it gives a general sense of the relationship of the data sets. I tried to drink in all the code lines she was writing to get a general sense of what I would be doing when I left her office. Thankfully, my supervisor sent me off with her own code script, which was an invaluable jumping off point for my own fiddle with the data.
At home, I poured over videos about the basics of the programme, and through trial and error, I managed to make something appear on my screen! I have to admit that I did get frustrated many times, and needed to taken breaks. But with a little patience with myself and perseverance, I began to understand what I was writing down, and how the code created an outcome.
It was also fun to play with the graphics that the programme can code for, allowing me to match my graph to the colour scheme of my poster.
Ultimately, I enjoyed the coding process, which is something I never thought I would say. It was so rewarding to watch a summer's worth of work all come together onto a single graph, which is why maths is so great. No matter what field you study, almost everyone can read a graph, and therefore almost everyone can take something away from my research.


Please sign in
If you are a registered user on Laidlaw Scholars Network, please sign in