A History Student’s Wrestle with Software
As I enter the last week of my Laidlaw research, I find myself excited about the ease with which I now launch QGIS on my computer, click “add a rector layer,” select a file, import, and repeat the process with a vector layer. Less than a week ago, I’d close my computer in frustration and make tea to avoid the sight of QGIS.
For the majority of my Laidlaw research, I dove head-first into traditional practices of historical analysis. I contacted and visited archives where I read and held postcards and fliers from 1911 in my hands. I consulted attendance and address lists in journals and census records from the time and used the British Newspaper Archive to read newspaper clippings from the Dundee Courier and Todmorden & District News 1911 editions. This immersion into historical research certainly felt like a treasure hunt, and I began to understand the difference between what we expect from historical data and what we find. I became accustomed to letting out an excited “yes!” over the small victories: coming across a mention of a historical actor in a newspaper that I spotted on an address list, or finally figuring out the occupation of another historical actor after intensely squinting at the cursive of the 1911 Census enumerator sheets. Slowly, unique snippets of the lives of early twentieth-century Scottish women Esperantists formed in front of me.
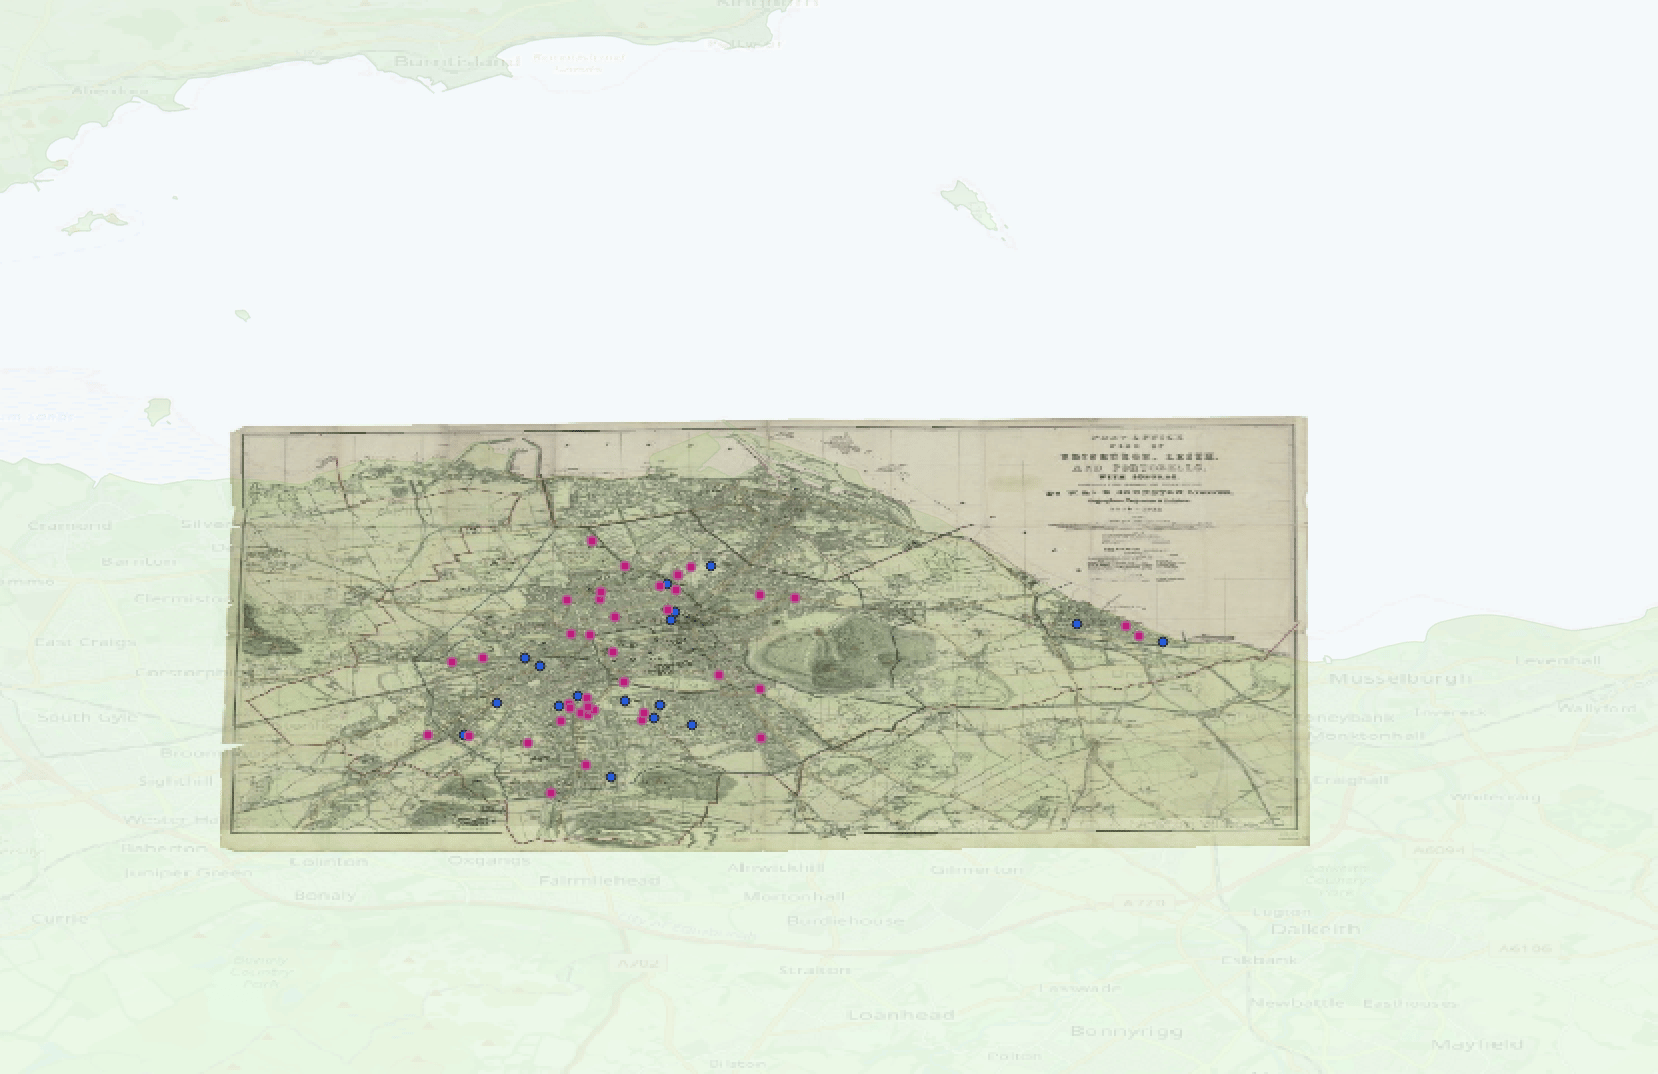
Right as I felt like I was becoming a “real” historian who understood the puzzle that is putting together the past, I realized I wanted to visualize the locations of some of these Scottish Esperantist women. This could enhance my analysis of the socioeconomic statuses of these women and whether or not several Edinburgh Esperantists were neighbors. When I brought this up to my supervisor, he happily explained how georeferencing works and how it could aid my research.
My first thought was that there was no way I would be able to maneuver software that could curate a map. Because of my subjects, I’m attuned to reading, not coding. Still, I knew I really wanted to map these women’s addresses, so I decided to give it a try.
At first, I felt overwhelmed by the millions of buttons and commands within the software. I tried to follow Youtube tutorials to gain a general understanding of the software, but as these tutorials were not specific to what I wanted to accomplish they were more frightening than helpful. This forced me to change my mindset about this software: I needed to complete a georeference (putting a historical map over a present-day map) of Edinburgh, and insert my coordinates of the Edinburgh residents’ addresses, that’s it. With this specificity in mind, I searched and followed step-by-step tutorials on YouTube that worked with georeferencing historical maps. From there, I began to feel much more comfortable adding vector and raster layers, shapefiles, and plotting coordinates.
From this practice, I realized comfortability with this exercise came from trial and error. I decided to reach out to a Ph.D. student my supervisor recommended who used the same software for a similar exercise as part of his research. During our meeting on Teams, he pointed out the importance of image pixels, color contrast, and the order in which I should add vector and raster layers. In just thirty minutes of asking questions, my confidence in fixing up my map improved immensely.
This computer science experience illustrated the rewards of stepping outside of my comfort zone to learn a new skill that I can now employ in my university career and beyond. It also taught me the importance of patience, staying focus on what I want to achieve, and utilizing the guidance of those more experienced than me. Now, as I enter the last stages of fixing up the quality and presentation of my maps, I rather enjoy the trial and error. Mapping is a key component in the practice of transnational history, and I know that this experience will enhance the sophistication of my Laidlaw research output. I would normally run away from any idea of maths, computer science, or even geography because of my lack of experience with it, but this mapping exercise has greatly strengthened my confidence in merging my love for humanities with outside disciplines.

I am a fourth-year English and Modern History student at the University of St Andrews. My research looked at the intersection of gender history and transnational history by examining women's involvement in the Esperanto movement in Scotland and the Midlands, and my leadership-in-action was the Think Pacific Health Promotion project. I'm interested in all things art, history, literature, and social change!


Please sign in
If you are a registered user on Laidlaw Scholars Network, please sign in
That's definite one for the CV Claire! So glad that you learned an amazing new skill from stepping out of your comfort zone.
I'm really excited to see where your research goes- keep it up!