Field Journal: Week 3
Now that the research is coming close to the halfway point, I found myself having a clearer focus. Many of the communications with the non-profits have also come into place. I'd like to share my research in 3 layers, the data layer, the equity layer, and the routing layer.
The Data Layer:
Now I have a set of publicly available data: 528 currently operating food pantries, soup kitchens, and food help sites from the NYC government food help website; an estimation of food donation origins; and NYC government's food insecurity and poverty rate for each NTA( (Neighborhood Tabulation Area). I'm meeting with the largest non-profit organization Operations Team Director on Monday to hopefully get more data on the donor information and their current routing process.
The Equity Layer:
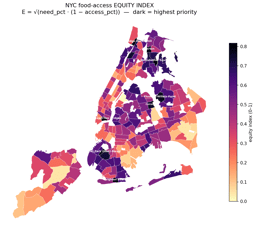
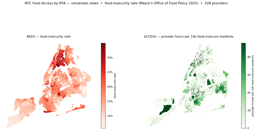
The NTA calculation is at the heart of my model. There are many organizations and initiatives helping food insecurity around the city. But if the algorithm currently used only minimize travel time, the algorithm may choose easy, nearby, already well-served areas. This would be "efficient" in a narrow sense, but not necessarily fair. The equity index I calculated will serve as a weight for the model, prioritizing high-need and low-access areas, distributing food efficiently and equitably. I used the GeoJSON file with polygon shapes for NYC neighborhood, plotted pantries by their longitude and latitude. My equity data is attached to neighborhoods, so I place every pantry pin onto a neighborhood map and correspond it to a need/access index. So for each pantry I have information that represents their location, neighborhood, demand, and equity priority. And the equity index is calculated based on estimated food insecurity rate by the NYC government, and food access measured by pantry visibility. A pantry is useful if it's nearby, has high capacity, and is not overwhelmed by too many people.
The Routing Layer:
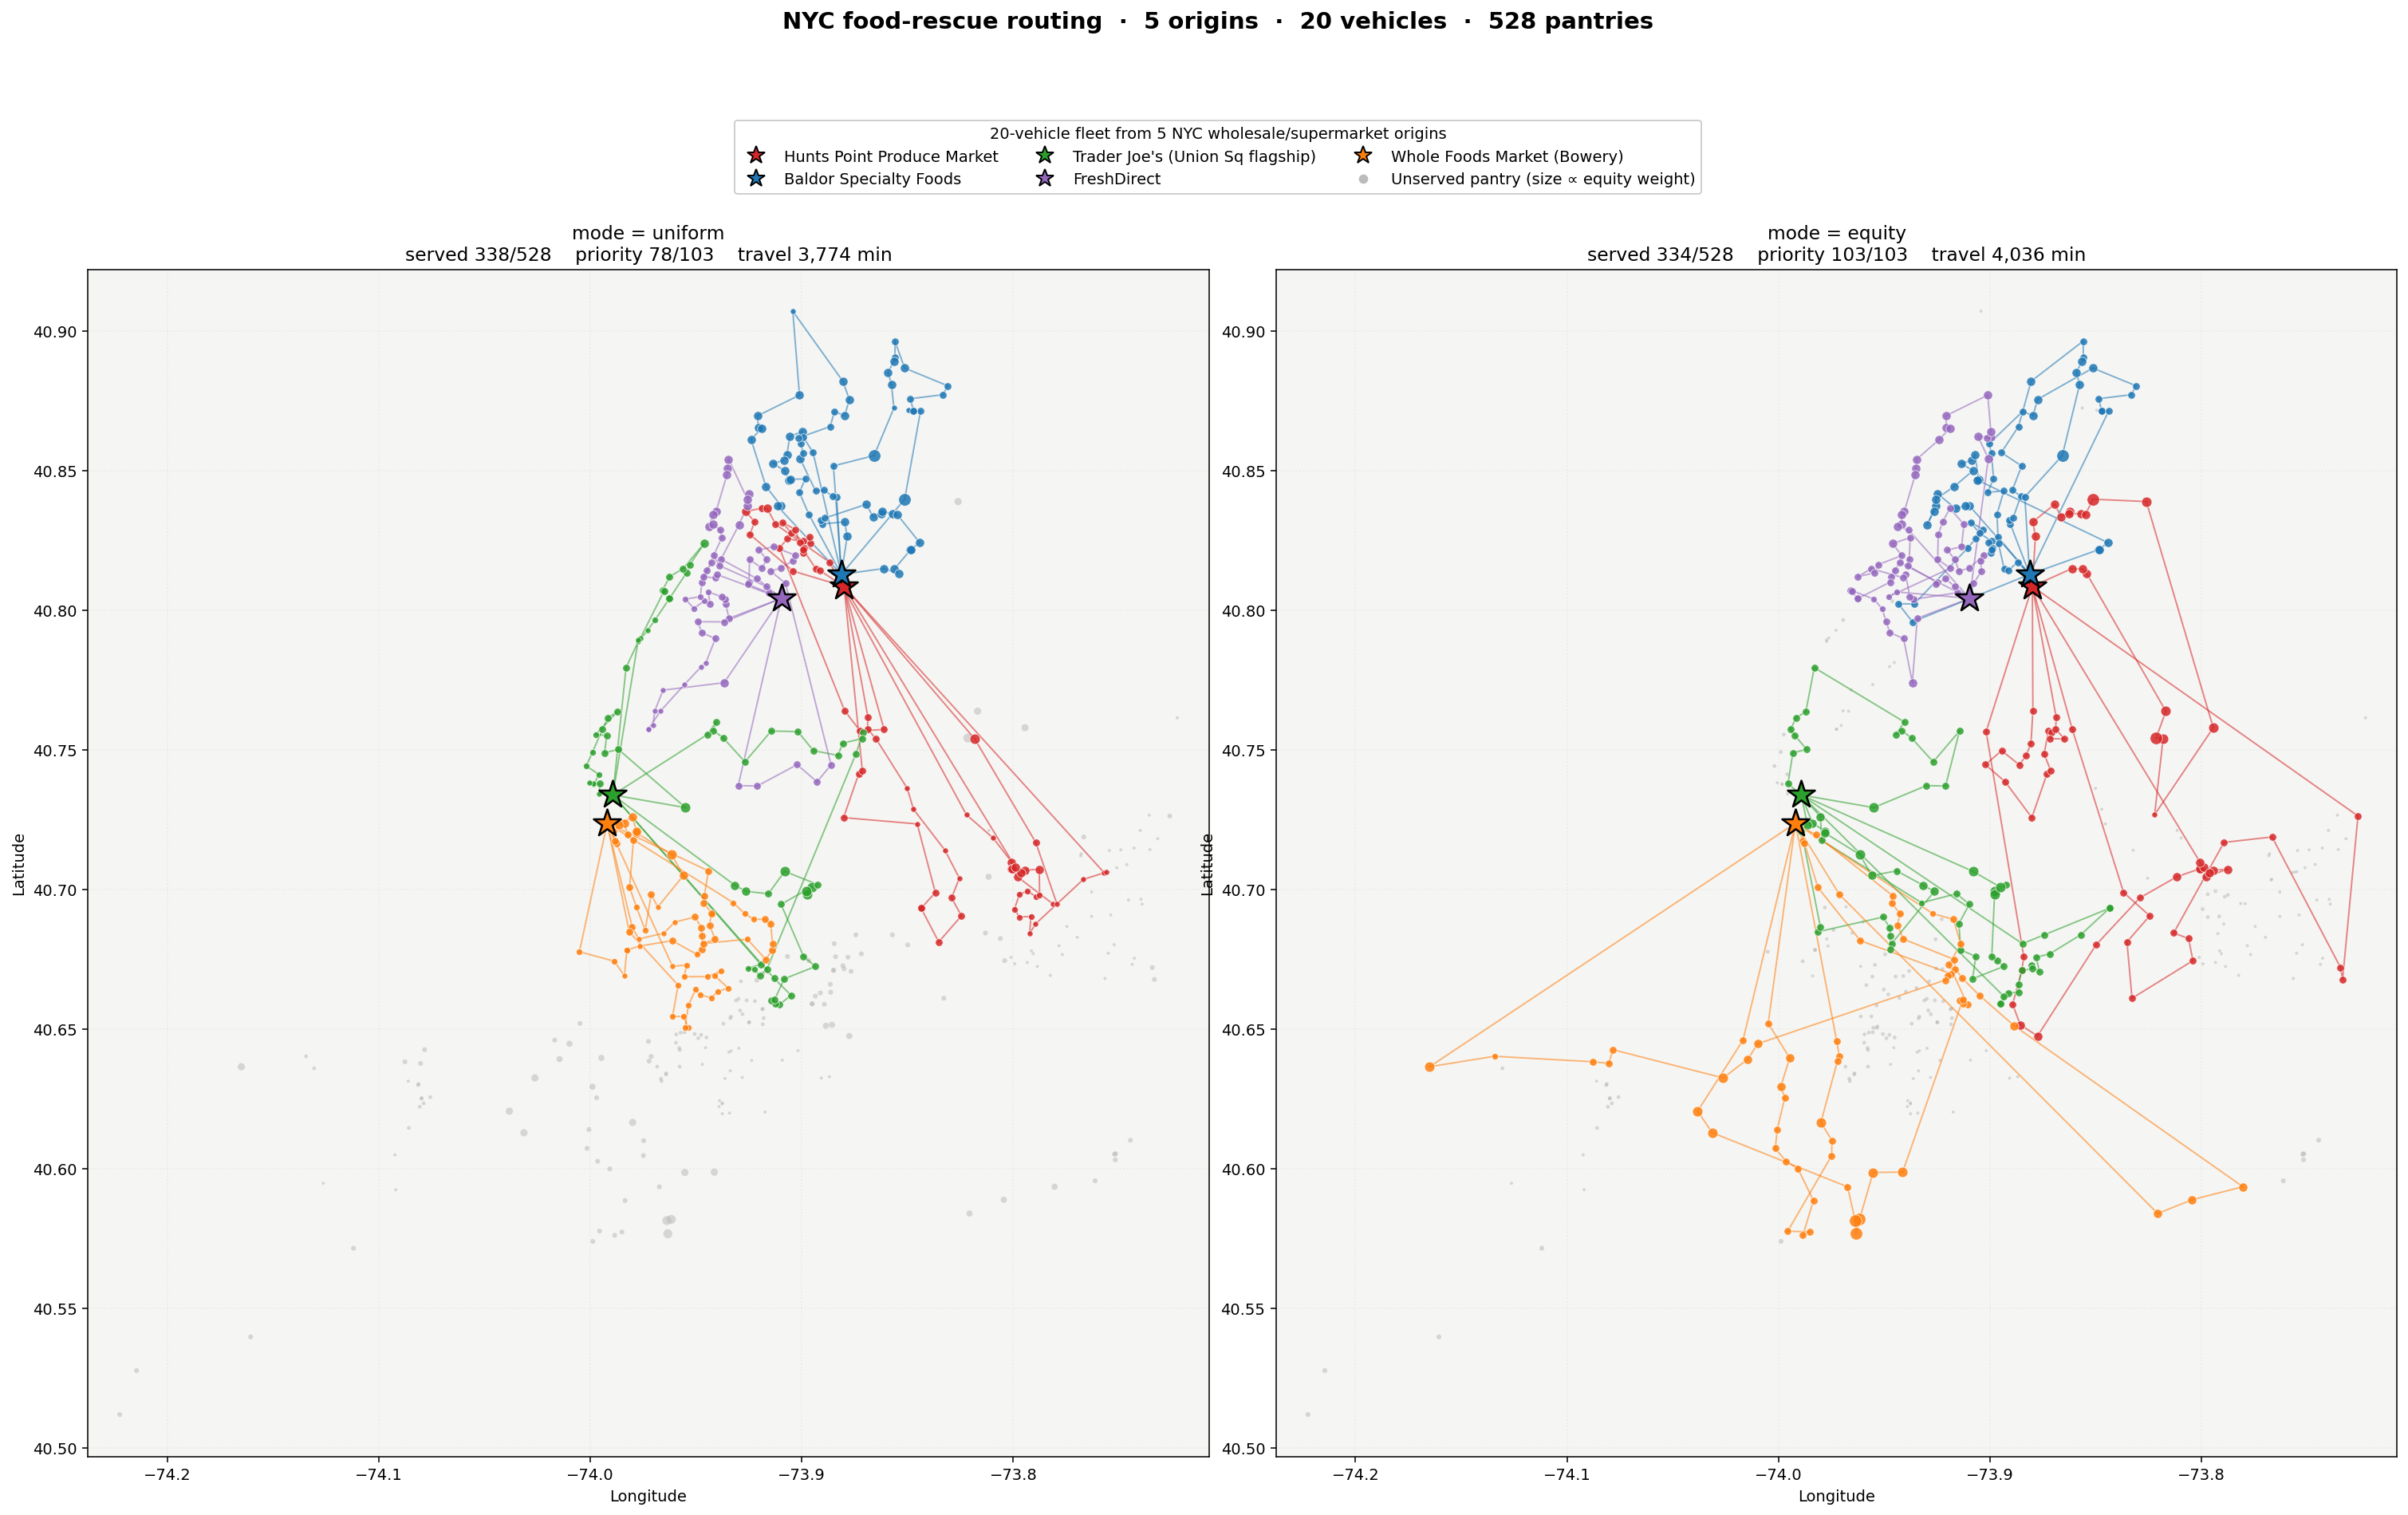
I have just started working on the main routing model: a multi-depot capacitated VRP with optional skipping and time windows. There are two decision variables in the model: route arcs (an edge from location i to location j) and skip flags (a small and well-supported pantry may be skipped in this delivery). My model is trying to minimize total travel and service time, and prioritize pantries with a higher equity score, which is achieved by forming a skip penalty. I currently coded 6 constraints, but I'm hoping to add more. The first is that every pantry give a binary outcome, the second is that every vehicle leaves and returns to its origin, then if a vehicle enters a pantry it must also leave from it, there is also a capacity for the vehicle, each vehicle also have a max number of minutes it can operate because of driver shift, and the route has to be connected. The first model without equity index, every pantry has the same skip penalty, but the second model gives high-need, low-access pantry a more expensive cost to skip based on their equity index.
I used construction through heuristic building the tool. The algorithm repeated asks which unserved pantry can I insert into any route at the lowest extra cost, adding stops along the way. Then there is a guided local search that cleans up the algorithm with a few instructions. Then the graph is color coded and expressed.
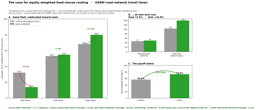
Currently the trade off for equity is 4 fewer total pantries, and about 262 minutes total on the vehicles. But I really want to see if this cost can come down, and there are a lot of refinements to be done with the current algorithm, especially adding time window. I current have 80/120 pounds per stop for the demand of each pantry, but this fluctuates a lot in reality, and the routing is directly linear distance instead of the actual routes, and food is treated as one generic category without distinction between non-perishable and fresh food. So a lot more to be done!
Now reflection on the leadership workshop:
How have the workshops and discussions on leadership this week changed your understanding of what leadership means?
I had the misconception of leadership being an innate ability, but I really do believe it can be learned and needs constant practice. My understanding of leadership now is the ability to assign the members suitable tasks, keep everyone engaged and motivated, and control the progress of the whole project.
How might you imagine applying one model of leadership during your Laidlaw summer on campus—either within the Laidlaw cohort or beyond this community? While we often associate leadership and leaders with seniority, how might leadership be modeled among individuals who are among the youngest people on campus (i.e. you!)?
I see myself as the leader of my Laidlaw project. I'm connecting different pieces and asking for help from a lot of people, but how to make them help willingly is a good question. I would like to consider what type of personality they are, what are they looking to gain, and try to motivate them to assist in my project this way. For example, for the meeting I have coming up, I want to motivate them to help me by saying that my research is free and low risk, and will provide meaningful result. I'm not trying to change their current routing model, I'm just trying to understand the problem, and provide a small prototype that could help compare route options, quantify tradeoffs, and identity where optimization may be most useful. This paper could also be a good advertisement point, and attract new donations for the organization.

Please sign in
If you are a registered user on Laidlaw Scholars Network, please sign in