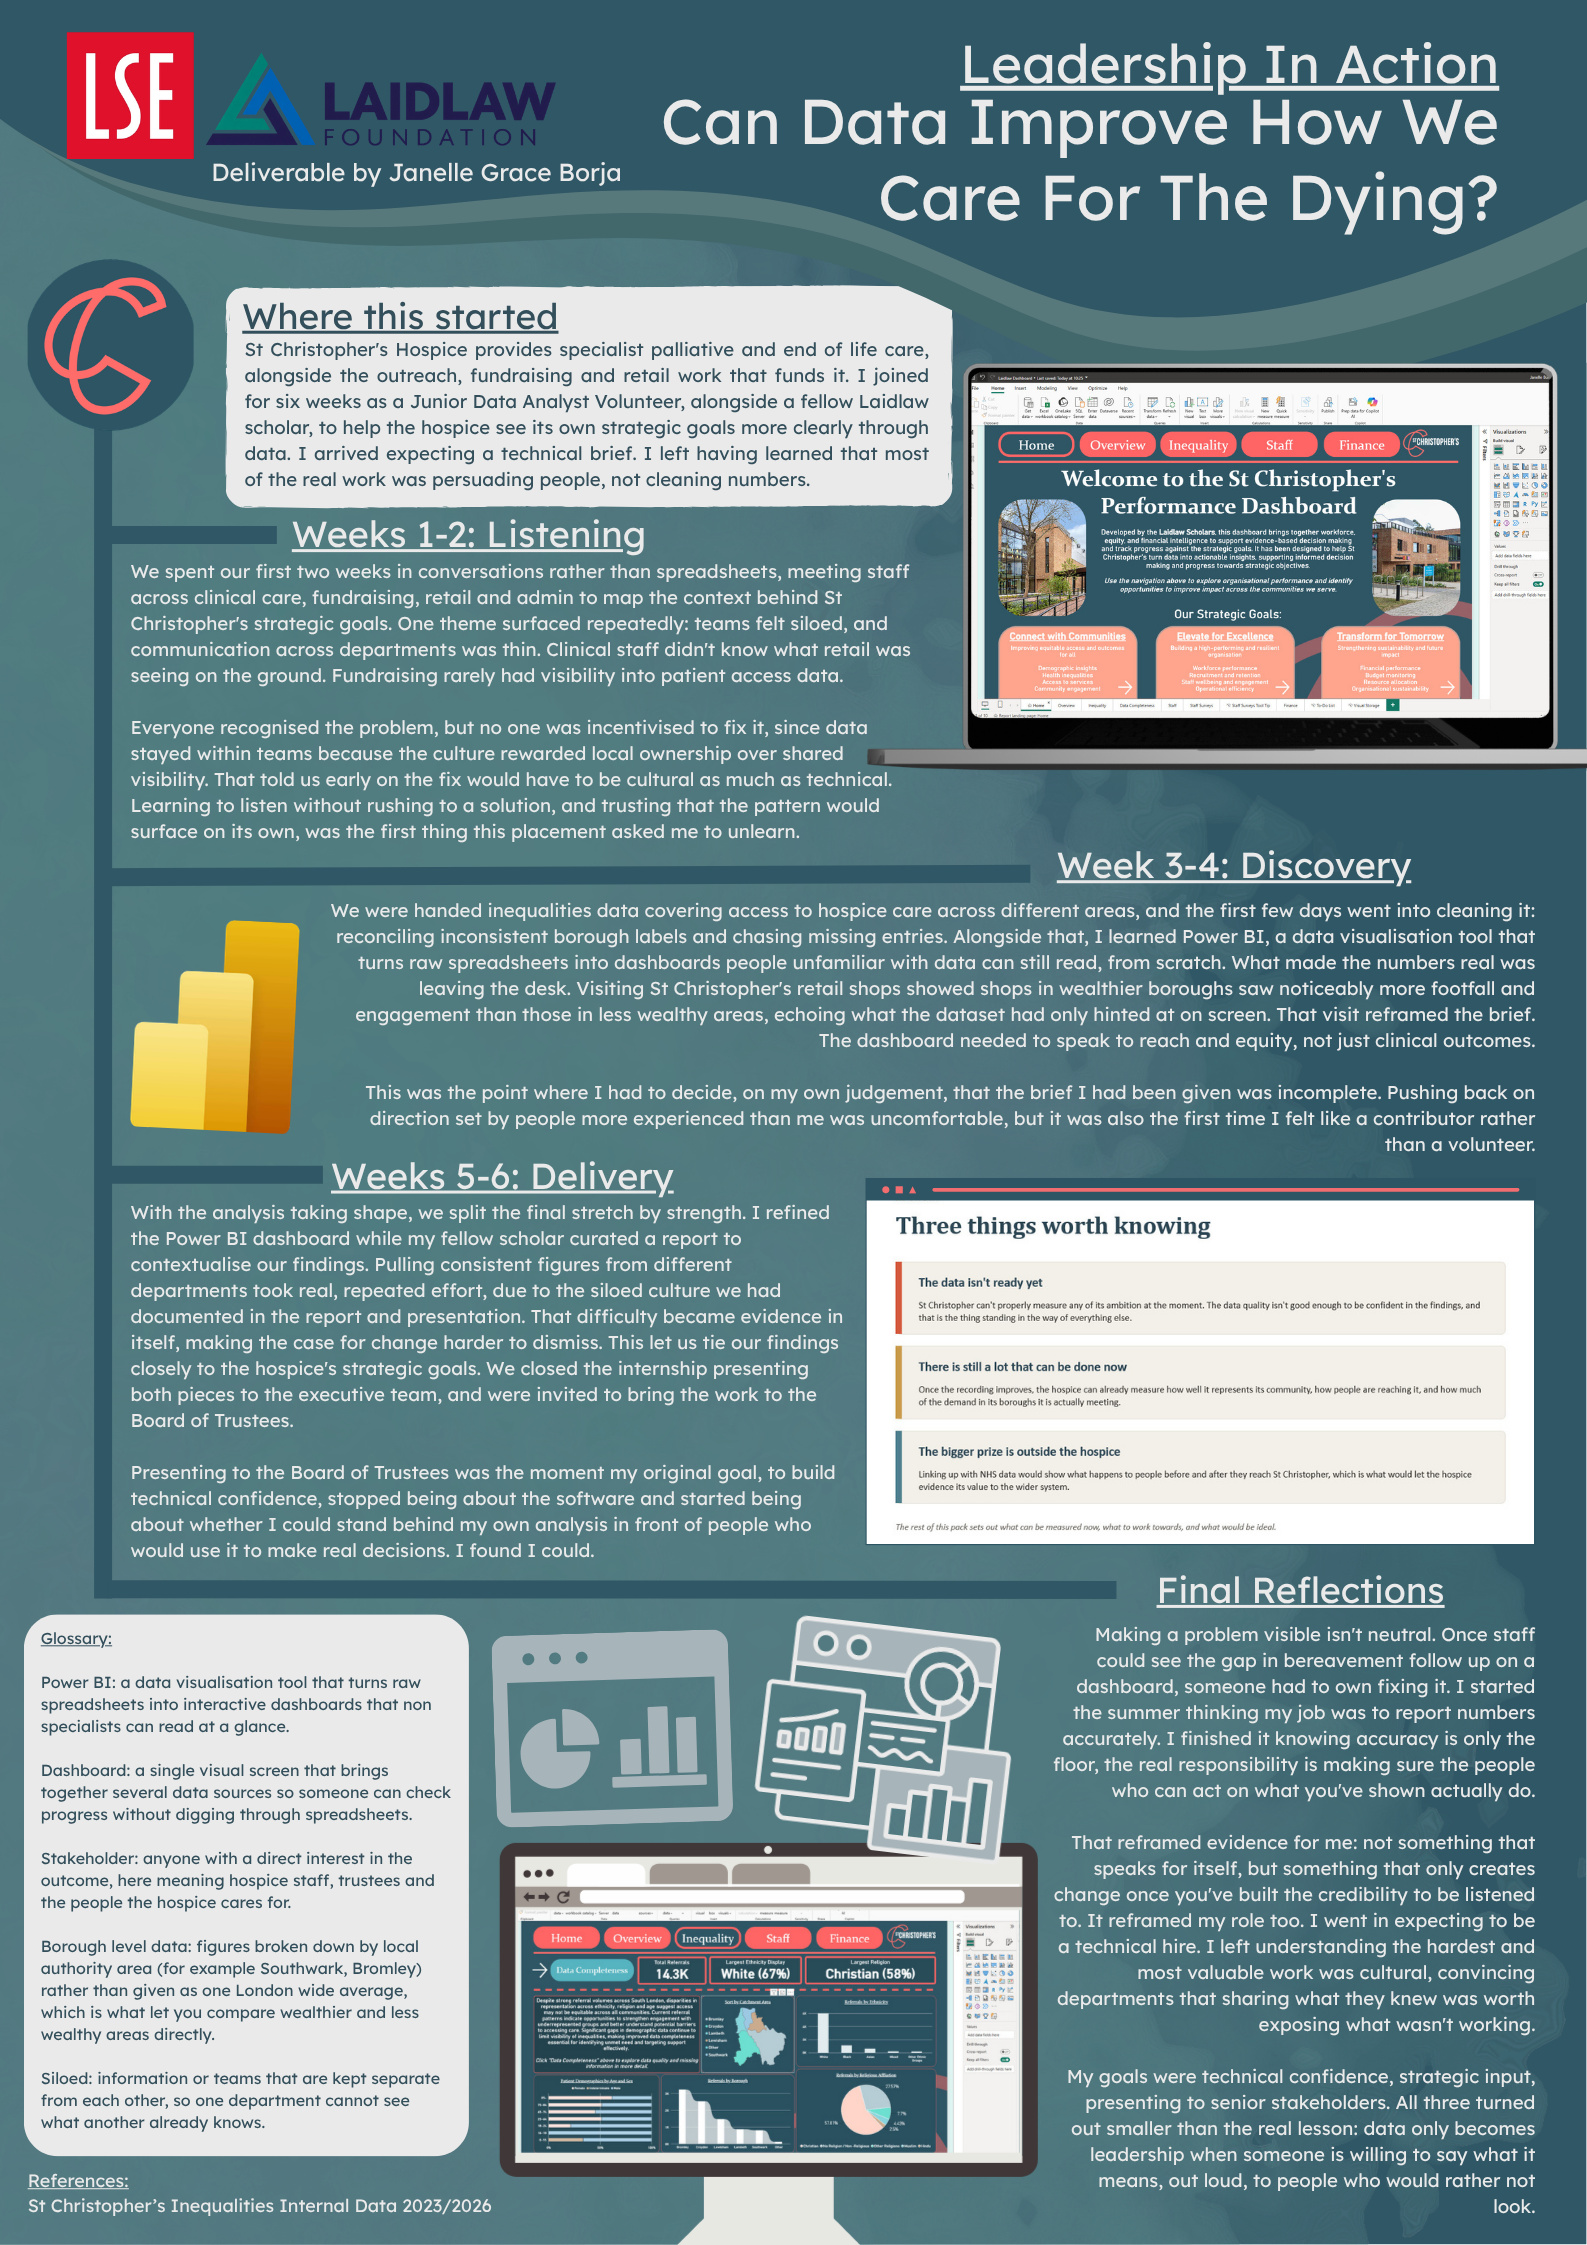
This poster documents a six-week placement at St Christopher's Hospice, undertaken as part of the Laidlaw Leadership in Action programme. Working alongside a fellow Laidlaw scholar as a Junior Data Analyst Volunteer, the project set out to help the hospice see its own strategic goals more clearly through data, and ended up revealing something less technical than expected.
The first two weeks were spent listening rather than analysing. Conversations with staff across clinical care, fundraising, retail and admin surfaced a recurring theme: departments were siloed, and information rarely crossed between them. Clinical staff had no visibility into what retail was seeing on the ground, and fundraising had little sense of patient access data. This told the team that any fix would need to be cultural as much as technical.
Weeks three and four moved into discovery. Inequalities data on access to hospice care was cleaned and structured in Power BI, a tool used to turn raw spreadsheets into dashboards that non specialists could read at a glance. A visit to St Christopher's retail shops confirmed a pattern the data had only hinted at: shops in wealthier boroughs saw noticeably more footfall and engagement than those in less wealthy areas. That observation reframed the brief around reach and equity rather than clinical outcomes alone.
The final two weeks focused on delivery. The dashboard was refined and paired with a report contextualising the findings, then presented first to the executive team and later to the Board of Trustees, where the work argued that the hospice's data was not yet ready to measure its own ambition, but that meaningful progress was already possible.
The poster closes on a reflection: that making a problem visible is never neutral, and that data only becomes leadership once someone is willing to stand behind what it shows.