Heat, cold, and stroke burden in Hong Kong — a monthly story still being written
Hi scholars —
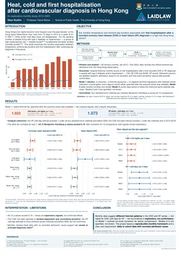
My Laidlaw project asks a deceptively simple question: in Hong Kong, how do months that carry more heat — or more cold — relate to stroke hospital burden?
The design is a monthly ecological time series from January 2013 to December 2023 (132 months). We assemble temperature and extreme-day measures from the Hong Kong Observatory, air-pollution context from the Environmental Protection Department, and population denominators from the Census and Statistics Department. The health side is monthly stroke admission aggregates from Hospital Authority data, which my collaborator Roro (Zhenyuan Liu) is preparing under governance rules. Until those cleaned aggregates are linked and checked, I am not reporting association results — and I will not dress practice runs up as findings.
That restraint is part of the science. Earlier Hong Kong work on daily temperature and mortality (notably Jingwen Liu and colleagues, 2020) found a larger cold-attributable mortality burden than heat. Separate lab work models excess deaths under heatwave definitions. Our estimand is different: monthly thermal exposure and stroke morbidity aggregates. Same city, related climate story, not interchangeable claims.
The other lesson of this summer has been definitional honesty. “Hot month” is ordinary English and a methods problem. A month can be hot because its average temperature is high, because it contains many very hot days or hot nights, or because heatwave spells cluster there. We catalogued many possible recipes, then chose to report a pre-specified panel rather than fish for the largest coefficient. Hogan leads the weather Methods; Roro leads the health-data construction; Professor David Bishai keeps the panel coherent. I am writing the rest of the Methods into a live shared manuscript so we stop emailing competing drafts.
If you want to see the weather half — mean monthly temperature, very hot days, hot nights, and cold days across eleven years, clearly labelled as exposure descriptives, not health findings — here is an interactive companion:
Interactive project site:
https://htmlpreview.github.io/?https://raw.githubusercontent.com/bobshenruililin/Laidlaw-Heat-Project/cursor/lsn-research-summary-1754/docs/lsn/index.html
Happy to swap notes with anyone working on climate, cities, health systems, or the awkward middle of a research summer — when the question is clear, the collaborators are real, and the headline result is still honestly unwritten.
— Bob Shen Ruililin · University of Hong Kong · Laidlaw Scholar