All Change Here: A Mid-Way Project Reflection

To say the direction of my project has evolved somewhat would be an understatement, equal in comparison to the evolutionary process of ape to Homo Sapien. What began as a statistical exercise in measuring the personal vote has become a renewed attempt to map the increasing importance of party affiliation in British politics, and its impact on the incumbency advantage. Though often confusing and frustrating, this evolution has been an overdue education in planning, adaptability and patience, and a strident reminder that research is anything but linear.
As reflected in my project outline, my initial aim was to use residual regression analysis and a uniquely large dataset (1832-2024) to estimate the “personal vote” of candidates, that elusive portion of their vote share which can be attributed to individual characteristics rather than national factors or partisan affiliation. Given time constraints and my unfamiliarity with regression statistics, I opted for the regression’s error term (ε) as a measure of the personal vote: what remains as a residual after accounting for all the factors we are aware of, such as a constituency’s natural partisan inclination and the annual party swing for that election. I met with my supervisor and with some helpful tips I was on my way: In week one I conducted a literature review of previous attempts of this measure, and in week two I began my own analysis. Though daunted by the prospect of attempting to improve upon or even contribute to a well-versed existing body of literature, produced by experts in the field, I found a pool of articles which supported the use of regression analysis in the broad sense, though each research design I pored over seemed more complex and intricate than the last, utilising more variables and in-depth data than I had available, but covering far fewer datapoints. The intent of my research was to add breadth to our understanding of voter motivation, and so my approach had to be different. Following a crash-course in R and some initial analysis I was left with graphs like those below, displaying a clear fall in ε over time, a result I was initially thrilled with. Alas, perhaps this happiness was overstated.
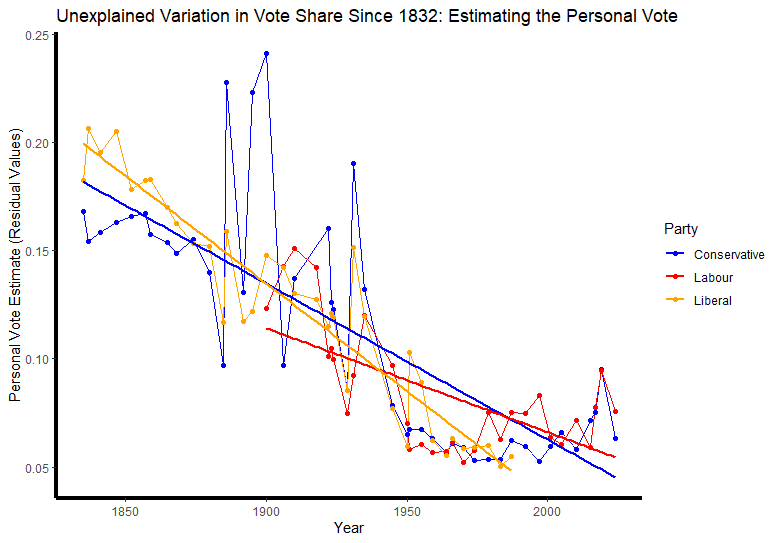
As I was learning the ropes of a new coding language and getting to grips with the data, it occurred to me that ε could contain much more than I had bargained for and in reality the ‘personal vote’ would likely be a fraction of the values I was getting, and that it was probably not the best idea to base my research on, quite literally, an error. This idle thought was heavily confirmed by my supervisor at our Monday meeting, and we concluded that in order to retain methodological integrity and do this properly, I ought to investigate something my data could say for certain, as opposed to estimating something it could not. Rather than interpreting what is missing, I should consider what is present.
The other value available in my rudimentary toolbox was the value of R2, representing the proportion of the dependent variable’s variation can be explained by the independent variable. In this case, how much of a candidate’s vote share can be explained by x, y and z. In an effort to retain the theoretical work I had completed thus far, and to pivot my focus rather than dismiss it completely, I decided to investigate how the other variables I had available to me have changed across the period, notably party affiliation. It is a widely accepted view that British politics has become increasingly partisan in the post-war era, and I had the perfect dataset at my fingertips. This pivot, though certainly the right decision, intimidated me somewhat. Despite assurances from left, right and centre that “research should not be linear,” I was missing any kind of experience to support this assertion which, at the time, seemed at best an overstatement and at worst an excuse for poor planning. Reflecting on this pivot, it has become clear to me that I could not have been more wrong: in the field of research (even at the earliest level) we are operating in a whirlwind of spanners, and no matter how much one plans, prepares and thinks ahead, they are going to slam into our progress one way or another. That’s just how it works. Despite embracing this change, I failed to lay the groundwork for what turned out to be a fairly significant pivot. On reflection, grounding my new direction in a slightly different body of literature and drafting an up-to-date plan would have focused my attention and time more effectively, resources which have become more valuable in my eyes whilst undertaking this project. Instead of taking the considered approach, I jumped headfirst into more analysis and more coding.
Week three was spent constructing a variable for incumbency. Given that my new direction required accurate and broad data for incumbency and party affiliation, it made sense to begin the ordeal of data entry as soon as possible. In a spreadsheet of 90,000 entries, the man who can code well is king. And I wore no crown. My initial attempt to automate the procedure proved largely fruitless. Cleaning the dataset in every way possible, I broke each entry into alphabetised strings, removed excess punctuation, and made every effort to align the columns, removing by-election data and creating a dictionary to limit the impact of formatting irregularities. After a few days of floundering, I settled on a hybrid procedure, preserving the accuracy of matches whilst allowing its completion this decade. A function I scraped together in R managed to match approximately 70% of entries with a value (1 for incumbent and 0 otherwise), leaving me with ~30,000 candidates scattered across 150 years to manually code, a procedure taking several days and during which the value of attention and time was reiterated to me. This process certainly taught me patience. Upon completion of the incumbency variable I had access to a range of data unavailable to most previous articles on this topic, a goldmine of information and spanning a very broad range. I was then able to re-code my regressions to look at the R2 value, and begin to produce graphs examining the relationship between incumbency and partisan voting, illustrated in the below images. The findings surprised and excited me, as the initial results showed significant disparities between incumbent candidates and their challengers, a change which certainly deserved a theoretical explanation.
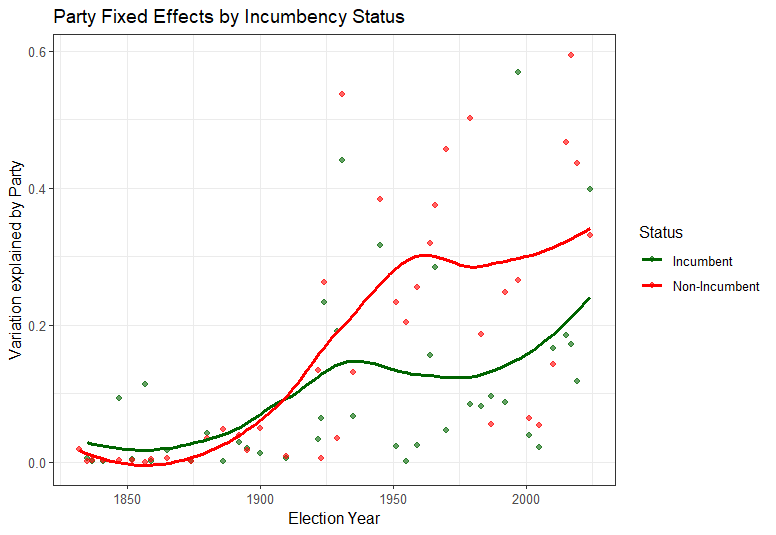
Despite a sizeable chunk of my research period being spent on manual data entry and cleaning, the statistical results produced have made the challenge worthwhile, and have reinforced my decision to pivot toward this question and renewed confidence in my direction of study. Following invaluable advice from my supervisor on improving the model, the inclusion of more controls and a consideration of the final report, I am relieved to have stopped pivoting (for the moment), and am now facing in a discernible direction. My journey so far has brought much in the way of learning and wisdom, be that a baptism-by-fire in R which will be invaluable as I progress through my studies, the importance of data management (often not glamorous or fun but most certainly necessary), and most importantly flexibility. Tying oneself to a certain direction and idealised destination removes the ability to respond to new developments, take criticism on board, and incorporate new ideas into the research design.
Looking forward to the second half of my research period, I plan to apply the lessons the above diversions have taught me. Namely ensuring my actions are grounded in the literature whilst also the most productive use of my time. Six weeks is far shorter than it initially seemed, and the next three will hopefully see my project take shape in readable, visible results, supported by theory and connected to current scholarship. As I look to consolidate a series of graphs, numbers and curves into a narrative tale of political evolution, I cannot afford any more significant pivots away from the body of literature currently on my desk.
In reflection, then, I am appreciative of the many learning experiences provided by my unexpected deviations, and ever-more conscious of the importance of good planning and literature grounding in a project such as mine. Let the drafting begin.

Hi I'm Freddie, a student in PPE at Durham University with particular interests in British Political history and the development of its constitution.
I am excited to express this in my research project, focusing on the impact of formalised political parties on voter partisanship and the incumbency effect. Whilst contributing to the development of an existing dataset containing parliamentary election data from 1832 onwards, I am aiming to perform data-driven alaysis to evaluate Britain's shift from a candidate-based political tradition towards the dominance of party labels.
Outside of my studies, I am a keen church bellringer, an avid reader, and enjoy exploring new places.